부스트 캠프 ai tech 3주 2일차 Data 시각화 (9)


Grid

  • 축과 평행한 선을 사용하여 거리 및 값 등을 보조적으로 알려준다
  • 색은 최대한 방해하지 않도록 무채색을 사용한다
  • Layer상 항상 맨 아래 오도록 zorder를 0으로 조정
  • axis를 이용해서 x, y축 또는 동시에 격자를 보이게 할 수 있다
  • which 를 이용하여 큰격자, 세부격자 등을 보이게 할 수 있다

추가적인 보조 처리

  • 보조선 긋기
    • axvline(), axhline()으로 수평선을 그을 수 있다
    • axvline(start, color, linestyle, zorder, alpha)
  • start : 선을 그어질 point
  • color : 색
  • linestyle : 선 스타일
  • zorder : z축 순서
  • alpha : 투명도 조절
1
2
3
4
5
6
7
8
9
10
11
12
13
14
15
16
17
18
19
20
def drow_graph(x, y, d, function_name, y_lim, x_lim, minmax):
fig, ax = plt.subplots(1, 2, figsize=(16, 4))

ax[0].plot(x, y)
ax[0].set_title(f"{function_name}")

ax[1].plot(x, d)
ax[1].set_title(f"{function_name} (Derivative)")
if minmax:
ax[0].axhline(max(y), color="red", linestyle="--", zorder=1)
ax[0].axhline(min(y), color="blue", linestyle="--", zorder=1)
ax[1].axhline(max(d), color="red", linestyle="--", zorder=1, xmax=0.5)

for i in range(2):
ax[i].axvline(0, color="gray", linestyle="-", zorder=0)
ax[i].axhline(0, color="gray", linestyle="-", zorder=0)
ax[i].set_xlim(x_lim)
ax[i].set_ylim(y_lim)
ax[i].spines['top'].set_visible(False)
ax[i].spines['right'].set_visible(False)
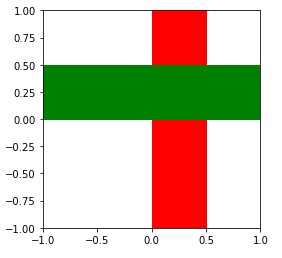
  • 보조 면 추가하기
    • axvspan(), axhspan()으로 영역에 색을 칠할 수 있다
    • axvspan(start, color, linestyle, zorder, alpha)
  • start : 시작 point
  • end : 끝 지점
  • color : 색
  • linestyle : 경계 스타일
  • zorder : z축 순서
  • alpha : 투명도 조절
1
2
3
4
5
6
7
8
9
10
fig, ax = plt.subplots()

ax.set_aspect(1)
ax.axvspan(0,0.5, color='red')
ax.axhspan(0,0.5, color='green')

ax.set_xlim(-1, 1)
ax.set_ylim(-1, 1)

plt.show()

reference

부스트 캠프 ai tech 3주 2일차 Data 시각화 (9)

https://kyubumshin.github.io/2022/02/05/boostcamp/week/week3/data-viz-9/

Author

KyuBum Shin

Posted on

2022-02-05

Updated on

2022-02-06

Licensed under

댓글